
Data
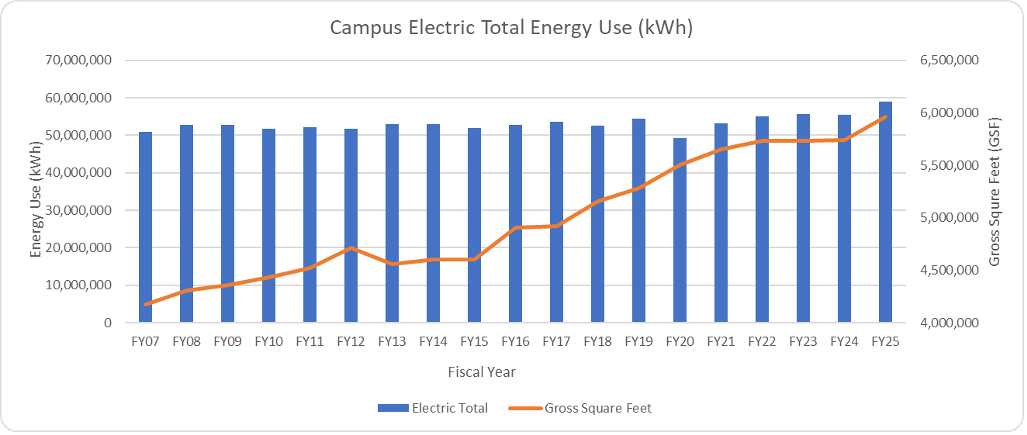
Campus electric use has increased 16% since FY07. Campus gross square feet increased 43% over the same period. Electric use per gross square foot has decreased 19%.
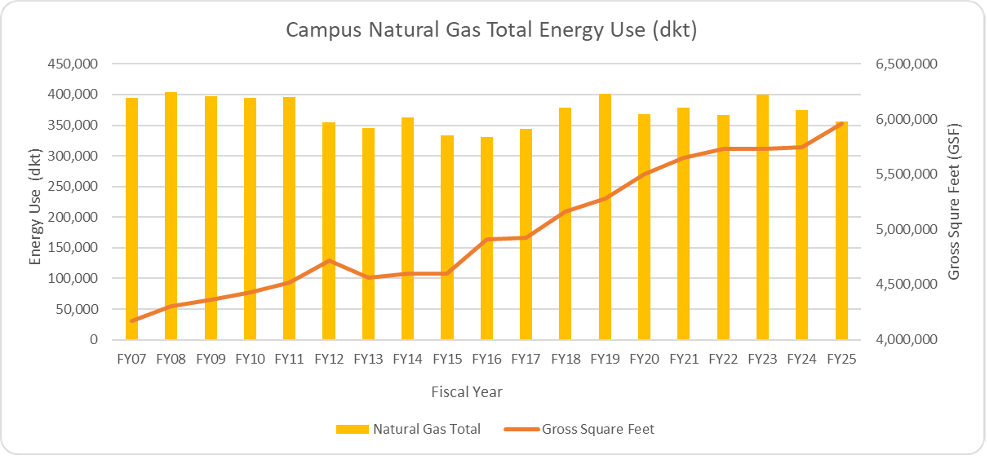
Campus natural gas use has decreased 10% since FY07. Campus gross square feet increased 43% over the same period. Natural gas use per gross square foot has decreased 37%.
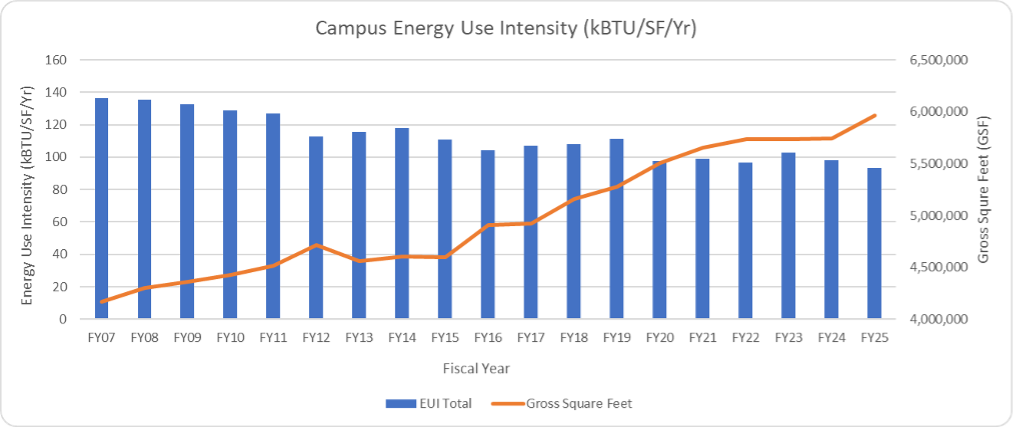
Campus energy use intensity decreased 31% since FY07. Campus gross square feet increased 43% over the same period.
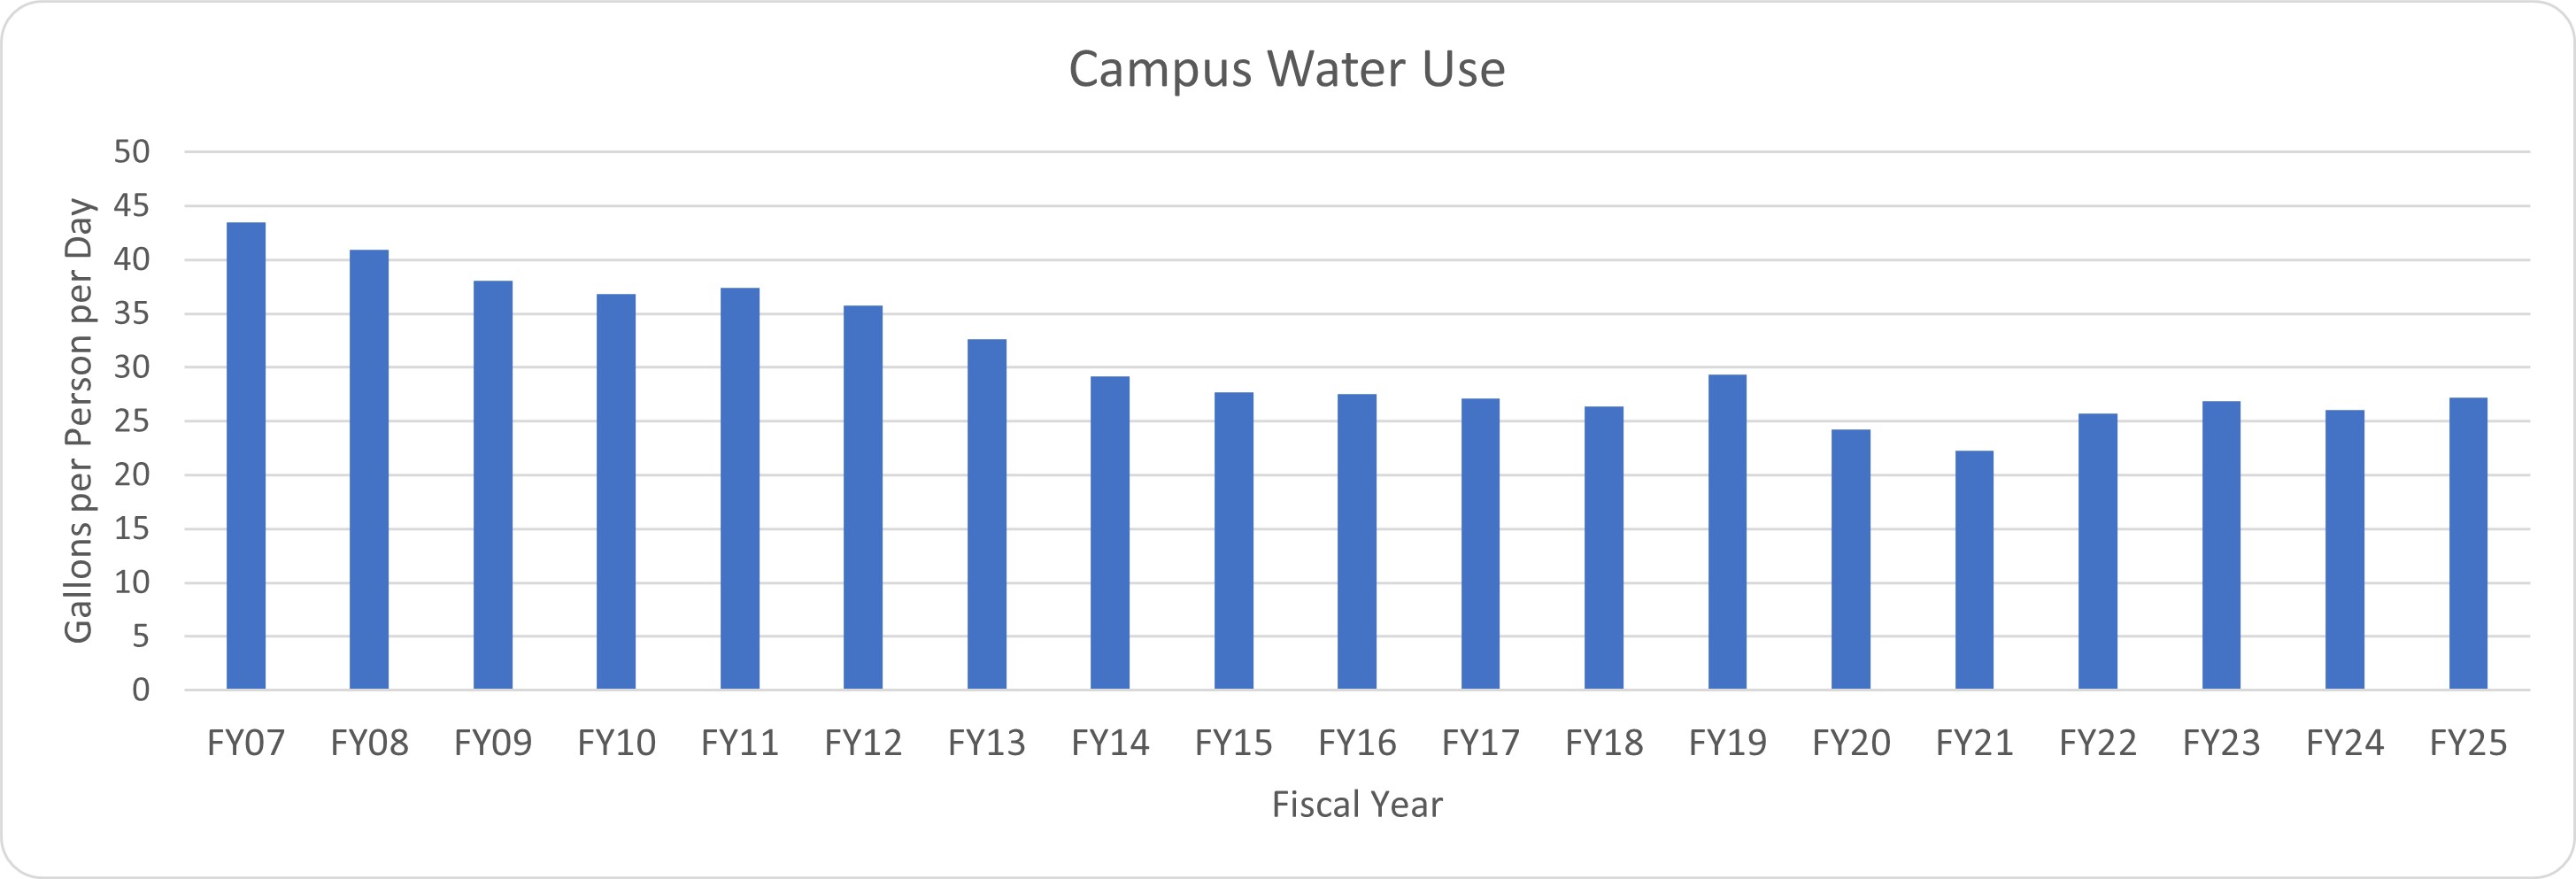
Campus water use per person per day decreased 37% since FY07.