Annual Research Expenditure Report
Montana State University research and creative activity demonstrates impact on the state’s and the world’s pressing challenges through application of our discoveries in communities, industry, and organizations.
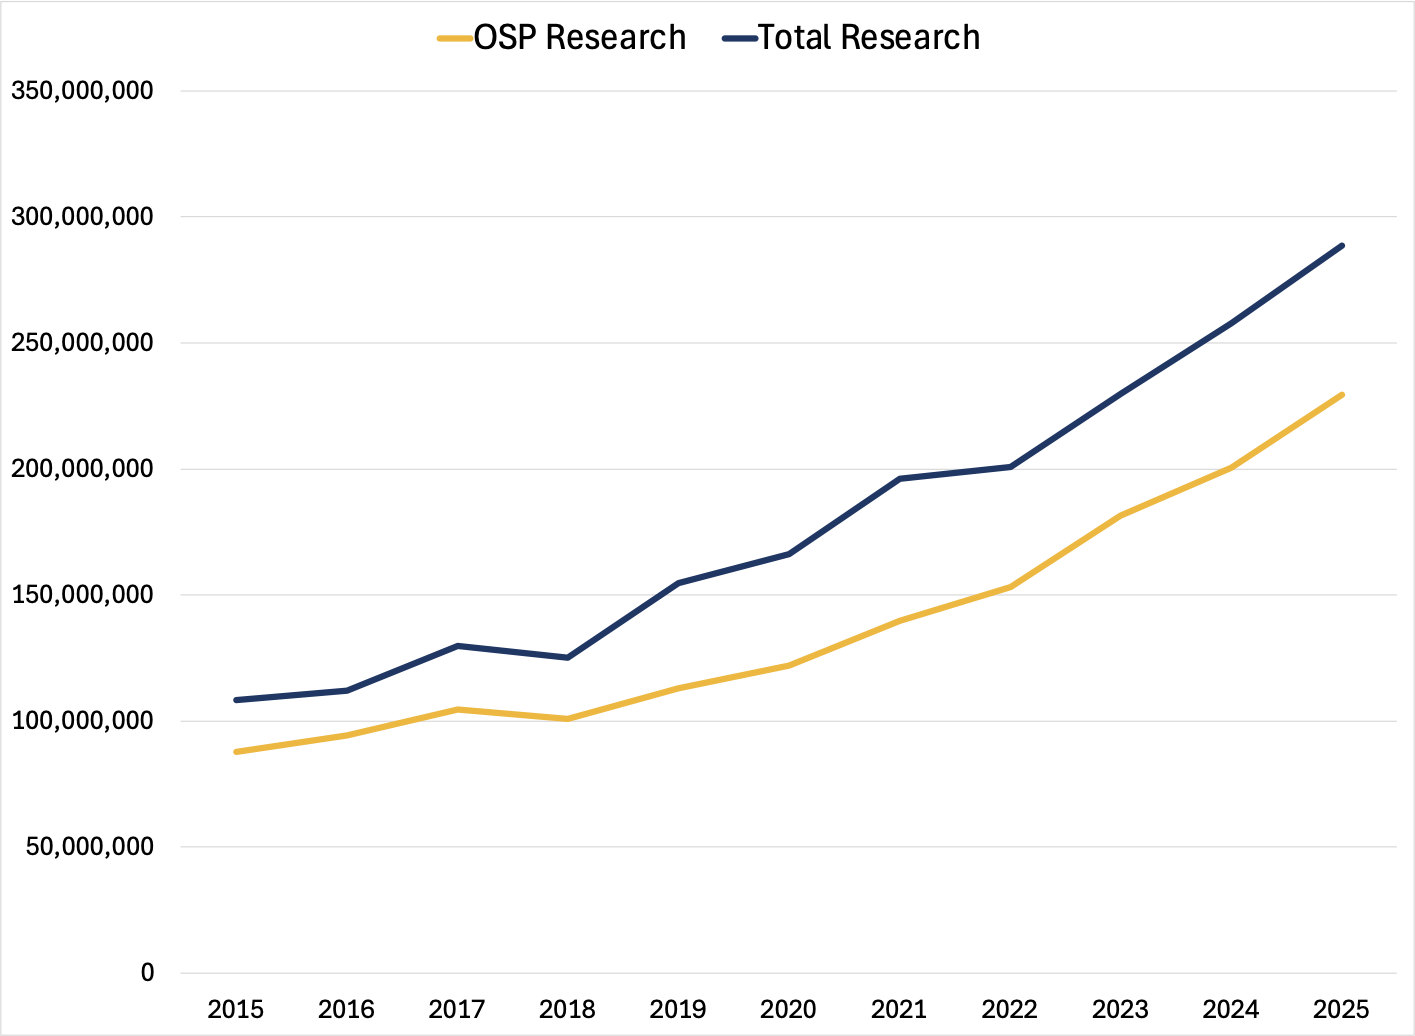
MSU Research Expenditures 2015-2025

|
Year
|
OSP Research Expenditures
|
Total Research Expenditures
|
|---|---|---|
|
2015
|
$87,806,094
|
$108,414,000
|
|
2016
|
$94,145,130
|
$112,073,000
|
|
2017
|
$104,567,529
|
$129,622,000
|
|
2018
|
$100,905,476
|
$125,129,000
|
|
2019
|
$112,991,204
|
$154,811,000
|
|
2020
|
$121,827,726
|
$166,285,000
|
|
2021
|
$139,774,047
|
$196,140,398
|
|
2022
|
$153,009,597
|
$200,819,805
|
|
2023
|
$181,315,069
|
$229,681,914
|
|
2024
|
$200,602,848
|
$257,920,284
|
|
2025
|
$229,310,267
|
$288,716,169
|
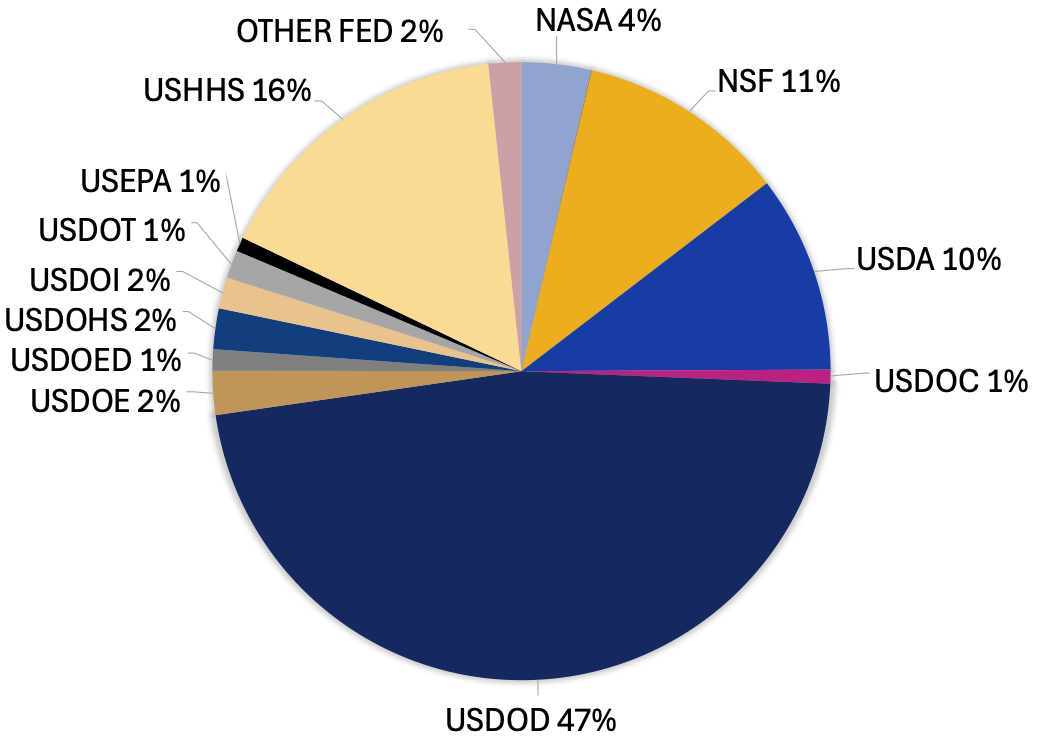
FY25 Expenditures by Federal Agency

| Federal Agency | approximate percent of total Federal Expenditures |
|---|---|
| NASA | 4% |
| NEA | 1% |
| NEH | 1% |
| NSF | 11% |
| USDA | 10% |
| USDOD | 47% |
|
USDOE |
2% |
| USDOED | 1% |
| USDOHS | 2% |
| USDOI | 2% |
| USDOT | 1% |
| USEPA | 1% |
| USHHS | 16% |
| Other | 2% |
FY25 Funding Sources:
Federal: 92%
State: 2%
Private: 6%
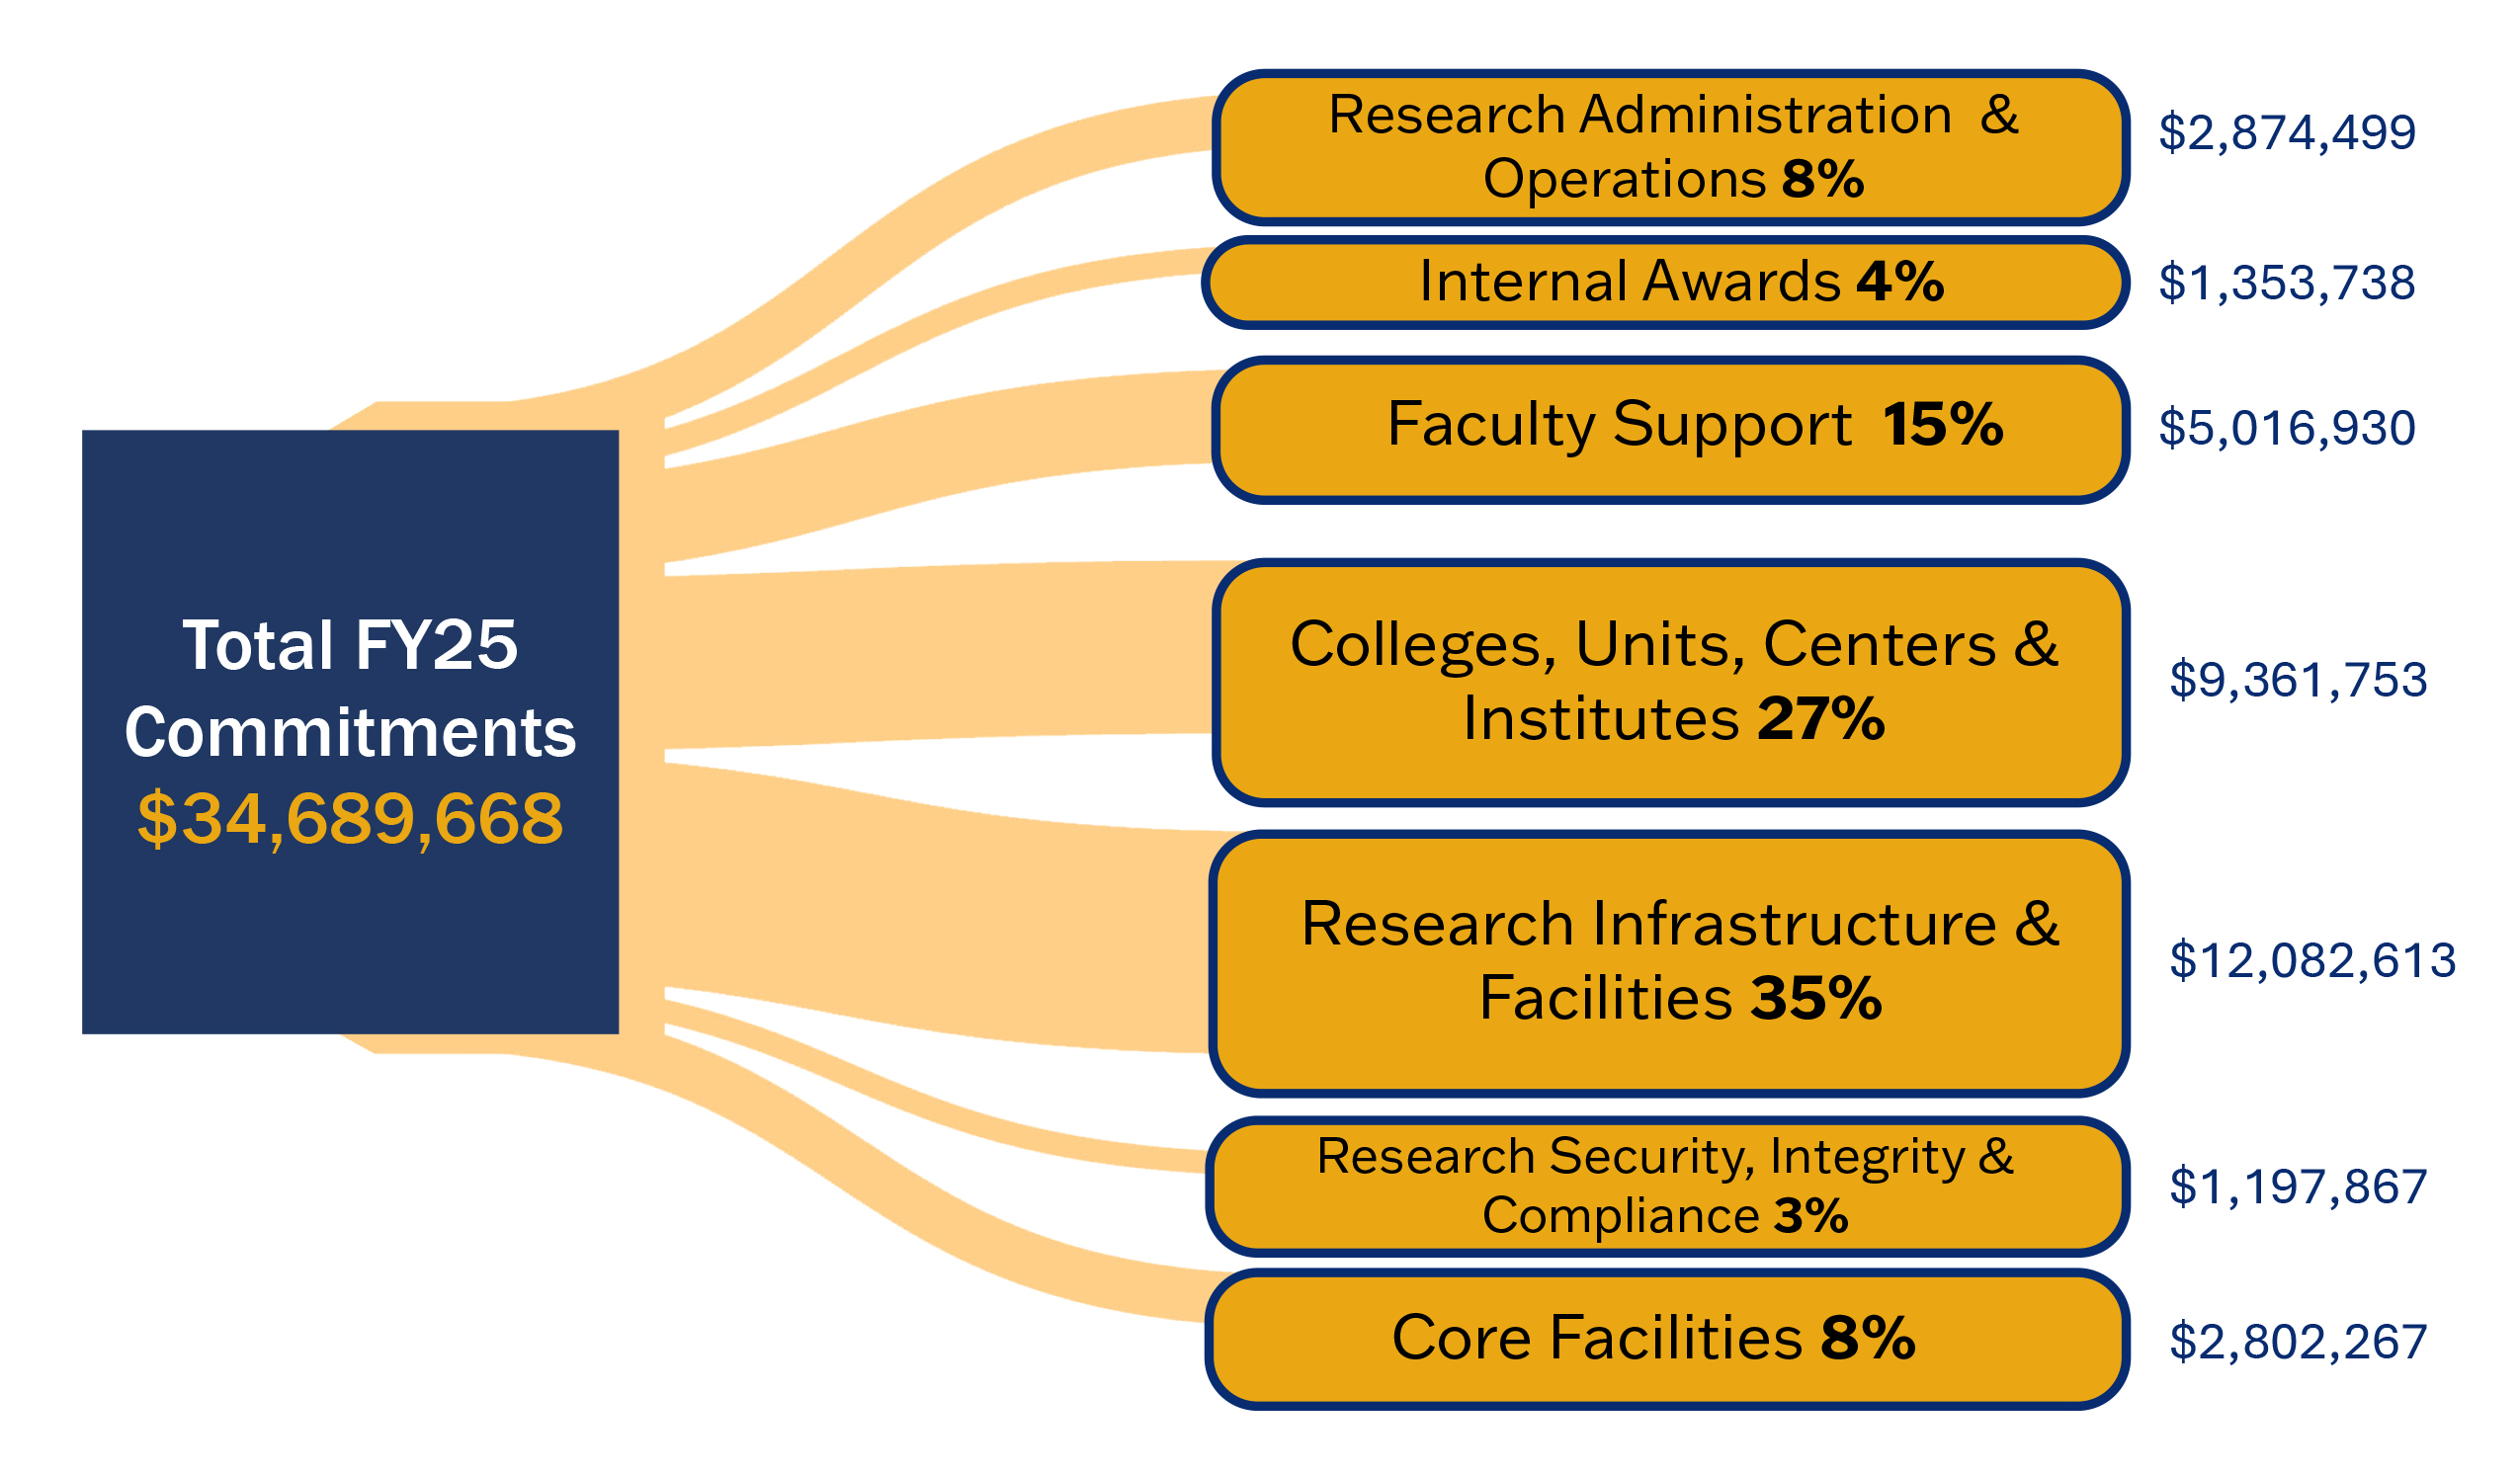
FY25 RED Investments
(includes Institutional Research Support)
Sponsored Program Expenditures: $229,310,267
Average IDC Rate Collected: 17.3%
IDCs Collected in FY25: $33,834,769
* IDCs = Indirect Costs (also known as F&As or Facilities and Administration Costs)

What's in the Buckets?
Research Administration & Operations (8%)
$2,874,499
Legislative Audit, Memberships Dues, Fees, & Research Operations
Internal Awards (4%)
$1,353,738
Research Collaborative Grants, Research Expansion Funds Grants, Scholarship & Creativity Grants, Proposal Enhancement Grant, Fulbright Awards, & Founders Day Awards
Faculty Support (15%)
$5,016,930
Bridge Funding, Faculty Startup, IRD Program, & Other Research Support
Colleges, Units, Centers & Institutes (27%)
$9,361,753
Colleges & Other Research Units, Centers & Institutes, Institutional Match, & Other Program Support
Research Infrastructure & Facilities (35%)
$12,082,613
Building Loans, Campus Leases, Campus O&M, Off-campus Leases, Off-campus O&M, Renovation, & Equipment
Research Security, Integrity & Compliance (3%)
$1,197,867
Research Security, Research Integrity & Compliance
Core Facilities (8%)
$2,802,267
Core Facilities, Core Facilities Grants, Core Facilities Operations
State Allocations for State-Funded Personnel

What's in the Buckets?
Research & Economic Development Administration & Operations (17%)
$651,007
Research & Economic Development Administration
Research Integrity & Compliance Administration (15%)
$561,124
Research Integrity & Compliance Administration
Research Development Administration (9%)
$338,726
Research Development Administration
Sponsored Programs Administration (43%)
$1,610,553
Sponsored Programs Administration
Undergrad Scholars Administration & Operations (11%)
$425,585
Undergrad Scholars Administration
Animal Resource Center Administration (5%)
$190,391
Animal Resource Center Administration
